
In the modern web world, performance is one of the most critical factors of success. Maximize user experience and search engine visibility with fast loading times and an optimized structure.
The performance of your website is one of the most important factors that directly affects the success of your digital presence. Today, users expect a website to load within 2-3 seconds. If this time is exceeded, a large portion of visitors will leave the page and turn to your competitors. Research shows that every 1-second delay in page loading time can lead to a 7% decrease in conversion rates.
Performance issues not only affect user experience but also seriously damage your search engine optimization. Google started using Core Web Vitals metrics as a ranking factor from 2021. This means that slow-loading sites will drop in search results, and organic traffic will decrease significantly.
⚠️ Experienced Problems and Effects
📉 Loss of User Experience
Slow loading times negatively affect user experience and lead to search engine visibility issues. This results in both visitor loss and decreased SEO performance. Especially on mobile devices, performance issues cause 53% of users to leave pages that take longer than 3 seconds to load.
🛠️ Technical Barriers
Unoptimized images, unnecessary JavaScript files, inadequate caching strategies, and delays in server response times are among the most common performance problems. When these issues combine, the total loading time of your site can reach unacceptable levels.
📊 Core Web Vitals: Performance Metrics
Google's Core Web Vitals metrics measure three key aspects of user experience: loading performance, interactivity, and visual stability. These metrics objectively evaluate the quality of users' interactions with your website and directly affect your search engine rankings.
⏱️ LCP (Largest Contentful Paint)
Measures how long it takes for the largest content element on the page to load. The ideal value is under 2.5 seconds. If LCP is slow, users may leave the page while waiting for the content to load.
⚡ FID (First Input Delay)
Measures the time from the user's first interaction to the browser's response. It should be less than 100ms. If FID is high, users may not receive a response when they click buttons and become frustrated.
📐 CLS (Cumulative Layout Shift)
Measures unexpected layout shifts as the page loads. A score below 0.1 should be targeted. If there is a CLS problem, users may click on the wrong place and have a bad experience.
🎯 User-Centric Experience
Each of these metrics represents a different aspect of user experience. Google measures the quality of your site using this data.
🚀 The Impact of Performance on SEO
When it comes to search engine optimization, performance is no longer an optional factor, but a necessary requirement. Google uses a ranking system that prioritizes user experience, and slow sites are penalized in this system. Especially with the mobile-first indexing strategy, mobile performance has become even more critical. When a page's loading time increases from 1 second to 3 seconds, the bounce rate increases by 32%. When it increases to 5 seconds, this rate jumps to 90%.
🔢 Ranking Factor
Page speed is one of Google's over 200 ranking factors and is even more important on mobile. Slow sites drop in rankings.
👆 Click-Through Rate (CTR)
Slow sites have lower click-through rates in search results. Users give up before entering or waiting for the site to load.
🕷️ Crawl Budget
Performance issues slow down the crawl speed of bots. This negatively affects the indexing speed and the crawl budget allocated to your site.
🌟 Page Experience
Core Web Vitals are an important part of Page Experience signals. Google rewards sites that provide the best experience to users.
🛠️ Comprehensive Optimization Strategies
Optimizing web performance requires a multi-layered approach. The best results are achieved when both frontend and backend optimizations are applied together. Here are strategies that can dramatically improve the performance of your website:
🖼️ Image Optimization
Images make up 50-60% of the page weight. You can reduce file sizes by 25-35% using modern formats like WebP and AVIF.
Defer loading of unseen images with lazy loading. Use responsive images to serve the right size for each device. Increase global speed with CDN usage.
💻 Code Optimization
Reduce JS and CSS sizes by 20-40% with minification. Load only necessary code with code splitting.
Clean unused code with tree shaking. Speed up the start with critical CSS. Remove render blockers using defer/async.
💾 Caching Strategies
Effective caching accelerates repeat visits. Optimize browser cache and CDN cache layers.
Create offline-first experiences with service workers. Lighten server load by correctly configuring Cache-Control headers.
🌐 Server and Network
Server response time (TTFB) is the foundation of performance. Speed up data transfer with HTTP/2 and HTTP/3 protocols.
Use Gzip or Brotli compression. Distribute content from the server closest to the user's geographic location with CDN. Optimize database queries.
📱 Mobile Performance: The Primary Focus
As of 2024, more than 60% of global web traffic comes from mobile devices. Google's mobile-first indexing strategy has made mobile performance critical for SEO. Mobile devices often have slower processors and more limited network connections, so mobile optimization requires special attention.
Progressive Web App (PWA) technology is one of the most effective ways to optimize mobile performance. With service workers, app shell patterns, and offline functionality, you can provide fast, native app-like experiences. Adaptive loading strategies serve content based on the user's device and network conditions.
Images specially optimized for mobile devices, touch-friendly UI elements, and minimal JavaScript usage are mandatory. The viewport meta tag ensures correct responsive behavior, minimizing unnecessary touch events and animations. Frameworks like AMP (Accelerated Mobile Pages) can also be considered, especially for content-intensive sites.
📊 Performance Measurement and Continuous Improvement
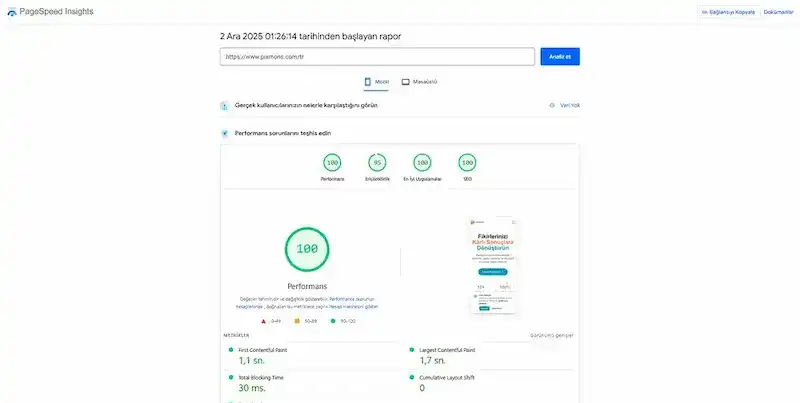
Performance optimization is not a one-time project, but an ongoing process. Regular measurement and monitoring allow you to detect performance issues early and produce proactive solutions. Tools like Lighthouse, PageSpeed Insights, WebPageTest, and Google Search Console are indispensable for measuring performance.
With Real User Monitoring (RUM) tools, you collect real user data and evaluate it together with lab data. By setting performance budgets, you prevent new features from negatively affecting performance. You integrate performance tests into your CI/CD pipeline, performing automatic checks before each deployment.
You correlate your analytics data with performance metrics to see how slow pages affect your business results. With A/B testing, you measure the impact of different optimization strategies and make data-driven decisions. You follow industry standards with competitor benchmarking, aiming to provide better performance than your competitors.
✅ Expected Results and Business Impact
Comprehensive performance optimization can achieve a 50-70% improvement in page loading times. This improvement directly affects your business results: a decrease in bounce rates, an increase in session durations, a 15-30% improvement in conversion rates, and an increase in organic traffic.
Research shows that a 1-second improvement in page loading time can lead to a 7-10% increase in conversion rates. For e-commerce sites, this means a direct increase in revenue. For content sites, it means more page views and ad revenue. For B2B sites, it means more lead generation opportunities. Additionally, excellent performance strengthens brand perception and increases user loyalty.